
BCG Matrix: What It Is, How It Works, and When to Use It
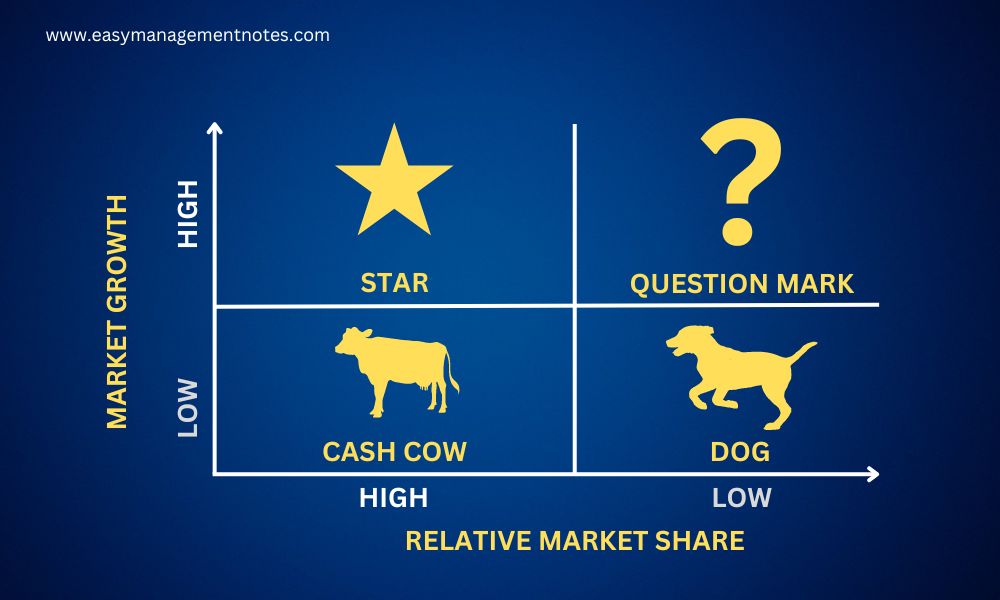
The BCG Matrix is a portfolio planning tool that helps businesses decide where to invest, where to maintain, and where to reduce focus across products or business units. It maps offerings using two variables: market growth rate and relative market share. The result is four categories: Stars, Cash Cows, Question Marks, and Dogs.
If you want the practical takeaway first, here it is: the BCG Matrix helps you identify which products deserve investment, which ones generate dependable cash, which ones are risky bets, and which ones may no longer justify resources. That is why it still shows up in strategy planning, portfolio reviews, and product discussions.
The framework was introduced by Boston Consulting Group in 1968 and became widely known as the growth-share matrix. It remains useful because it gives decision-makers a quick way to compare multiple products and discuss resource allocation more clearly.
Why the BCG Matrix matters
Most companies do not have unlimited budget, time, or leadership attention. The BCG Matrix helps prioritize which products need investment now, which products can fund future growth, and which products may no longer be worth supporting.
- Products that fund the business today.
- Products that are still gaining ground.
- Products with upside but high uncertainty.
- Products that may no longer fit the company’s long-term goals.
The two factors behind the matrix
1. Market growth rate
This measures how attractive or fast-moving a market is. High-growth markets often require more investment because competition is still intense and demand is still developing.
2. Relative market share
This compares your market share with the share of the largest competitor. In the classic model, higher relative market share often signals a stronger position and greater ability to generate cash.
The four BCG Matrix quadrants
1. Stars
Stars have high market share in a high-growth market. These products often lead attractive categories and usually need continued investment to hold that position.
- Invest to defend or grow leadership.
- Expand distribution or market coverage.
- Improve product features and differentiation.
- Prepare for the product to become a Cash Cow as the market matures.
2. Cash Cows
Cash Cows have high market share in a low-growth market. They usually generate more cash than they consume and often help fund Stars and selected Question Marks.
- Maintain market position efficiently.
- Focus on retention, margins, and operational control.
- Use excess cash to support higher-growth bets elsewhere.
3. Question Marks
Question Marks have low market share in a high-growth market. They operate in promising categories but have not yet secured a strong competitive position.
- Choose carefully which products deserve more investment.
- Set clear milestones for share growth and profitability.
- Test demand, pricing, and channel fit early.
- Exit faster if the economics do not improve.
4. Dogs
Dogs have low market share in a low-growth market. These products often have limited upside, although some may still support a niche audience or serve a strategic purpose in the portfolio.
- Reduce investment where appropriate.
- Divest, discontinue, or streamline the product.
- Keep it only if it serves a wider strategic objective.
BCG Matrix at a glance
Table: BCG Matrix summary
| Quadrant | Market growth | Relative market share | Cash position | Usual strategy |
|---|---|---|---|---|
| Star | High | High | Moderate to strong, but investment-heavy | Invest and defend leadership |
| Cash Cow | Low | High | Strong positive cash flow | Maintain and harvest efficiently |
| Question Mark | High | Low | Cash-hungry | Selectively invest or exit |
| Dog | Low | Low | Weak or limited | Divest, reposition, or minimize |
How to use the BCG Matrix step by step
Step 1: Choose what you are evaluating
Start with a clear unit of analysis, such as a product line, brand, service category, or business unit. The framework works best when each item is measured consistently.
Step 2: Define the market correctly
This is one of the most important parts of the process. A product can appear weak in a broad market but strong in a narrower and more relevant one.
Step 3: Calculate relative market share
Use the following formula:
Relative Market Share = Your market share ÷ Largest competitor’s market share
Step 4: Estimate market growth rate
Use industry reports, analyst data, company filings, or reliable trade sources. The goal is to understand whether the market itself is expanding in a meaningful way.
Step 5: Plot each product in the matrix
Place each product on the grid using:
- X-axis: Relative market share.
- Y-axis: Market growth rate.
Step 6: Decide what action each product needs
Once the products are plotted, the real value comes from the discussion around investment, maintenance, repositioning, or exit.
A simple example
Imagine a consumer electronics company with four products:
- Wireless earbuds: High share in a fast-growing category, so they qualify as a Star.
- Basic office printers: High share in a slow-growth category, so they fit the Cash Cow quadrant.
- Smart home hub: Low share in a fast-growing category, so it is a Question Mark.
- Portable DVD player: Low share in a slow-growth category, so it sits in the Dog quadrant.
That type of portfolio view helps leadership decide where to defend leadership, where to optimize profits, where to test growth potential, and where to reduce investment.
Advantages of the BCG Matrix
- It simplifies portfolio decisions.
- It improves resource allocation.
- It highlights balance across the portfolio.
- It creates a shared language for strategic discussion.
Limitations of the BCG Matrix
- It is intentionally simple and cannot capture every strategic factor.
- Market share is not always a perfect proxy for competitive advantage.
- Defining the market incorrectly can lead to poor decisions.
- Some low-share products still matter strategically.
- Growth does not always translate into profitability.
When the BCG Matrix works best
The BCG Matrix is most useful when a company has multiple products or business units, needs to compare investment trade-offs, and has reliable data on market growth and market share.
It is less useful when a business has only one or two main offers, when market boundaries are unclear, or when competitive advantage depends more on platform effects, switching costs, or ecosystem lock-in than on simple share-and-growth logic.
BCG Matrix vs. GE/McKinsey Matrix
Table: BCG Matrix vs. GE/McKinsey Matrix
| Framework | Main inputs | Best for | Trade-off |
|---|---|---|---|
| BCG Matrix | Relative market share and market growth | Fast portfolio prioritization | Can oversimplify reality |
| GE/McKinsey Matrix | Industry attractiveness and business unit strength | Deeper portfolio assessment | Harder to build and score consistently |
Common mistakes to avoid
- Using revenue growth instead of market growth.
- Comparing products from unrelated markets without clear definitions.
- Assuming every high-share product is highly profitable.
- Treating Dogs as automatic exits.
- Calling a product a Star without evidence of both growth and leadership.
- Building the chart once and never updating it.
Final take
The BCG Matrix is still useful because it answers a simple but important question: Where should a business place its resources across the portfolio? It is not a full strategy model on its own, but it remains a practical starting point for smarter resource allocation.
FAQ
What is the BCG Matrix in simple terms?
It is a portfolio tool that classifies products or business units into four categories based on market growth and relative market share.
What are the four quadrants of the BCG Matrix?
The four quadrants are Stars, Cash Cows, Question Marks, and Dogs.
What is the main purpose of the BCG Matrix?
Its main purpose is to help businesses allocate resources across products or business units more effectively.
Is the BCG Matrix still relevant?
Yes. It is still useful as a starting framework, especially when paired with deeper analysis.
What is the difference between a Star and a Cash Cow?
A Star operates in a high-growth market and usually needs continued investment, while a Cash Cow leads in a lower-growth market and typically generates surplus cash.
Can a product move from one quadrant to another?
Yes. A Question Mark can become a Star, and a Star can become a Cash Cow as market growth slows.
What is the biggest weakness of the BCG Matrix?
Its biggest weakness is oversimplification, since important factors like profitability, brand strength, and switching costs are not captured directly.
Is the BCG Matrix only for large companies?
No. Smaller businesses with multiple product lines or service categories can also use it if they have reliable market data.
References
- Boston Consulting Group – What Is the Growth Share Matrix?
- Boston Consulting Group – BCG Classics Revisited: The Growth Share Matrix
- Corporate Finance Institute – BCG Matrix Overview

- Everything you should know about the Case study - October 3, 2026
- Top Ten Online Data Analytics Courses in the USA - October 2, 2026
- Different Types of Organizational Structures with Examples - September 30, 2026