MBA Diagrams - Visual Learning for Smart Study

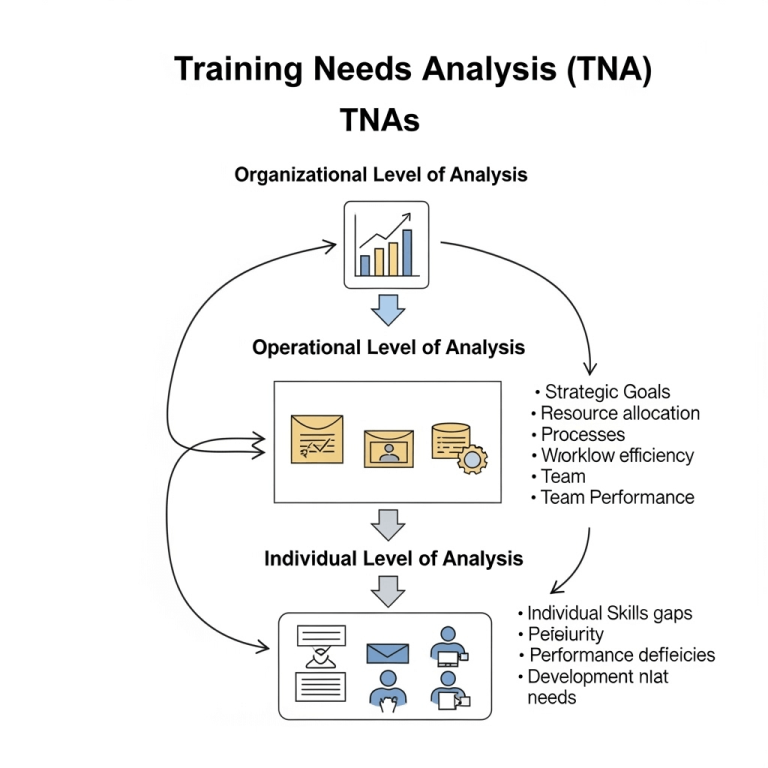
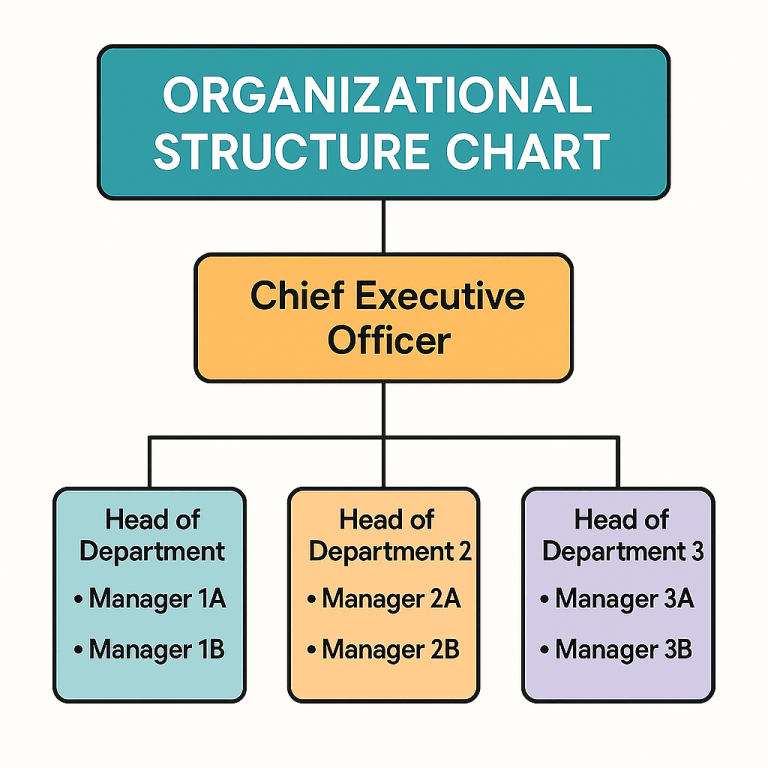
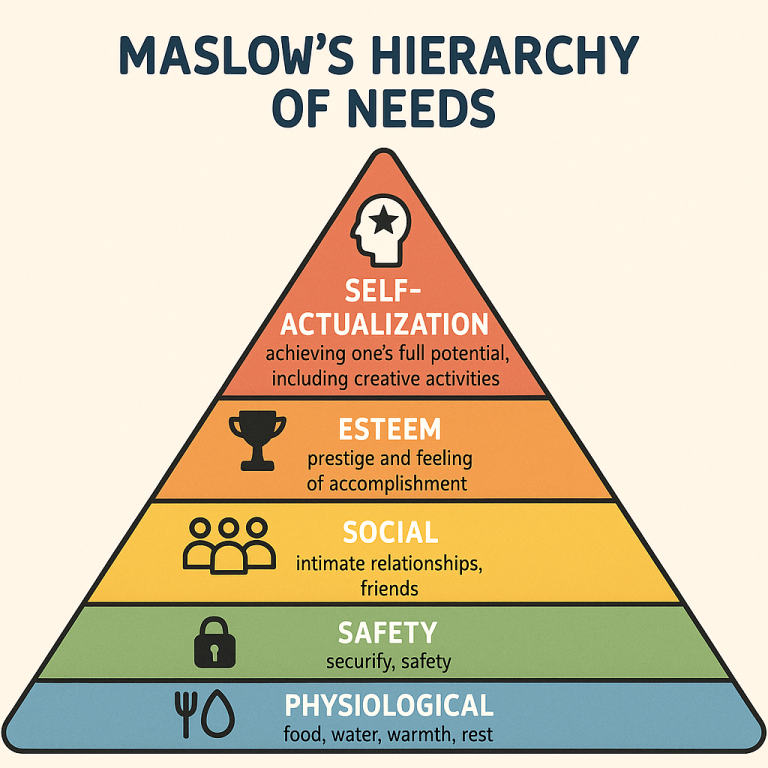
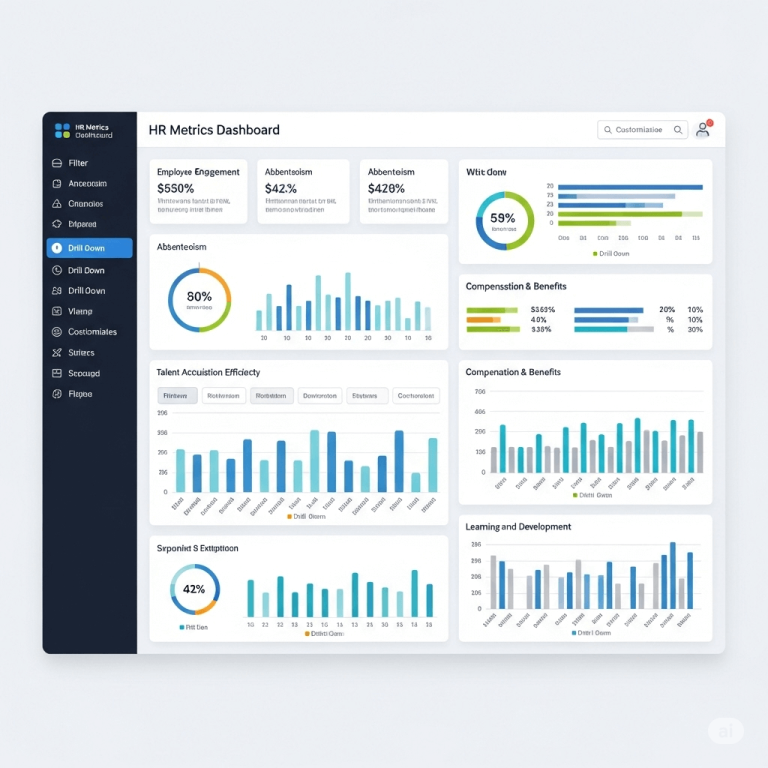
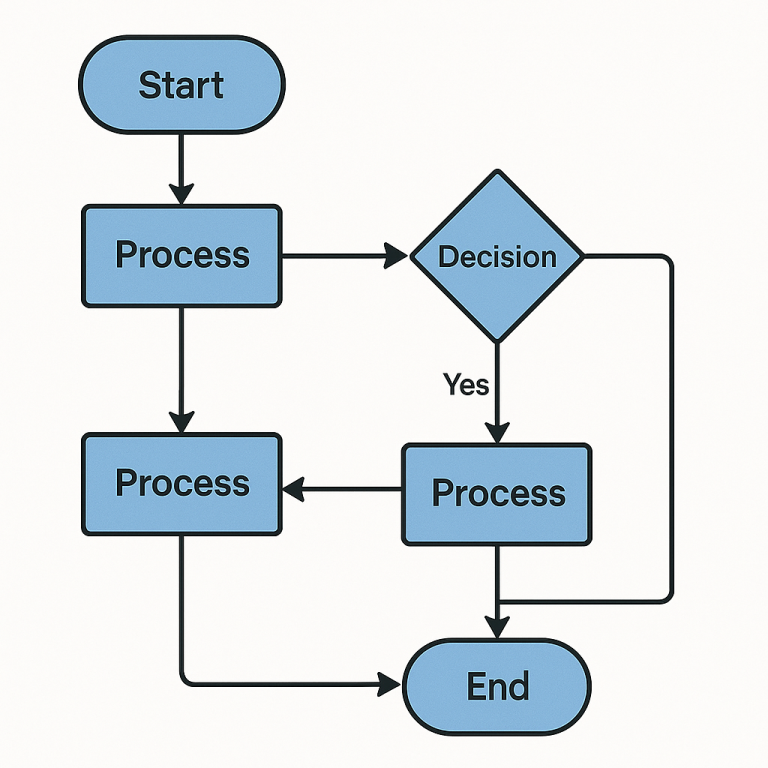
If you want to see a student’s eyes glaze over, hand them a textbook filled with dense text and zero visuals. On the other hand, give them a sharp diagram or a well-made flowchart, and suddenly things start to click.
Here’s why diagrams and flowcharts aren’t just nice extras in education but they’re must-haves.
Turning Messy Ideas Into Simple Maps
Let’s face it: most school subjects throw a lot of information at you. It’s easy to get lost. Diagrams and flowcharts act like a map. They break down complex ideas into clear steps or connections. For example, a flowchart showing the steps of cell division beats trying to memorize it from a paragraph.
When you can see how things fit together, you understand faster. That means less time rereading and more time actually getting it.
Helping Your Brain Remember More
We remember what we see. That’s not just a hunch, it’s backed by science. Visuals like flowcharts stick in your mind much longer than blocks of text. Instead of trying to remember a list of steps, you picture the chart and recall the process with all its details. Whether you’re studying the water cycle, a timeline of historical events, or the order of operations in math, a diagram leaves a stronger mark.
Solving Problems Step by Step
Here’s another win: flowcharts are problem-solving machines. Drawing out the process lets you spot where things go wrong. Missed a step? It jumps out at you. Flowcharts force you to think logically and in order. This is huge for science labs, math proofs, or even writing essays.
Getting Students to Learn Actively
There’s a big difference between reading something and making something. Creating a diagram or a flowchart means you’re working with the information, not just skimming it. You organize, sort, and connect ideas—skills that stick far beyond the test.
Useful for Every Subject (No, Really)
Diagrams and flowcharts work in every classroom. Science? Draw a life cycle. History? Map out events and cause/effect. Literature? Chart the plot. Even big projects get easier when you break them into parts visually.
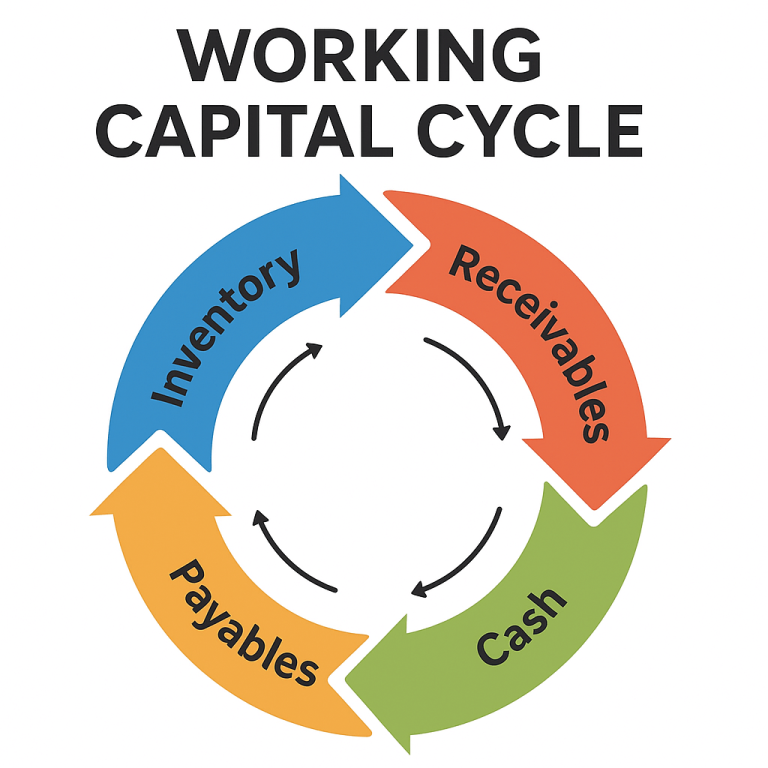
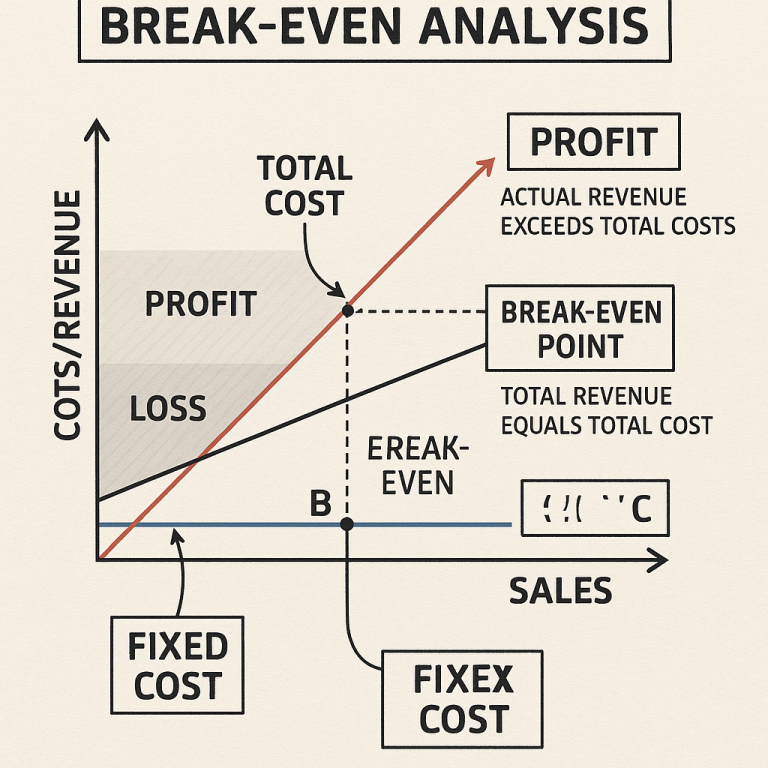
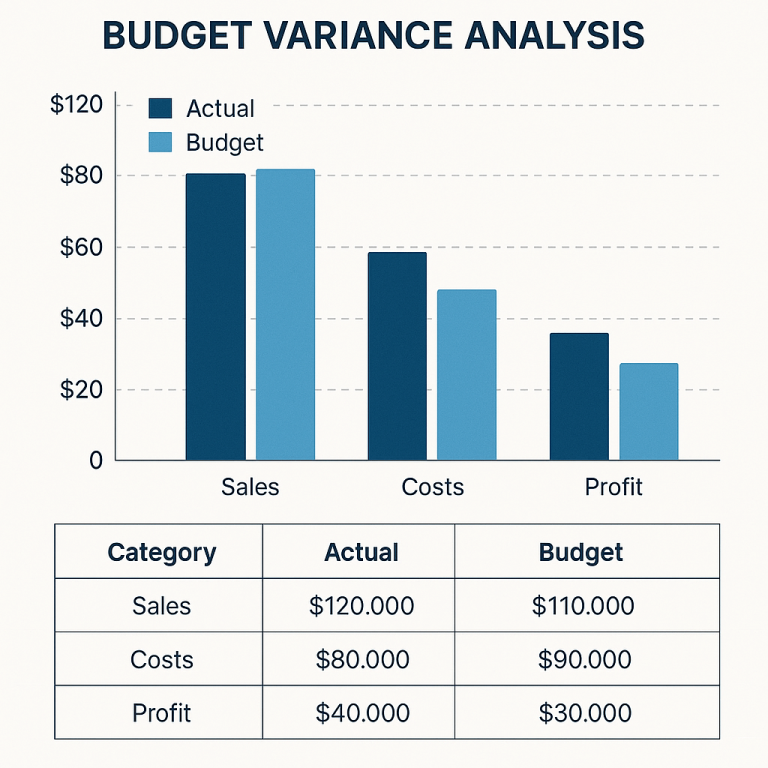
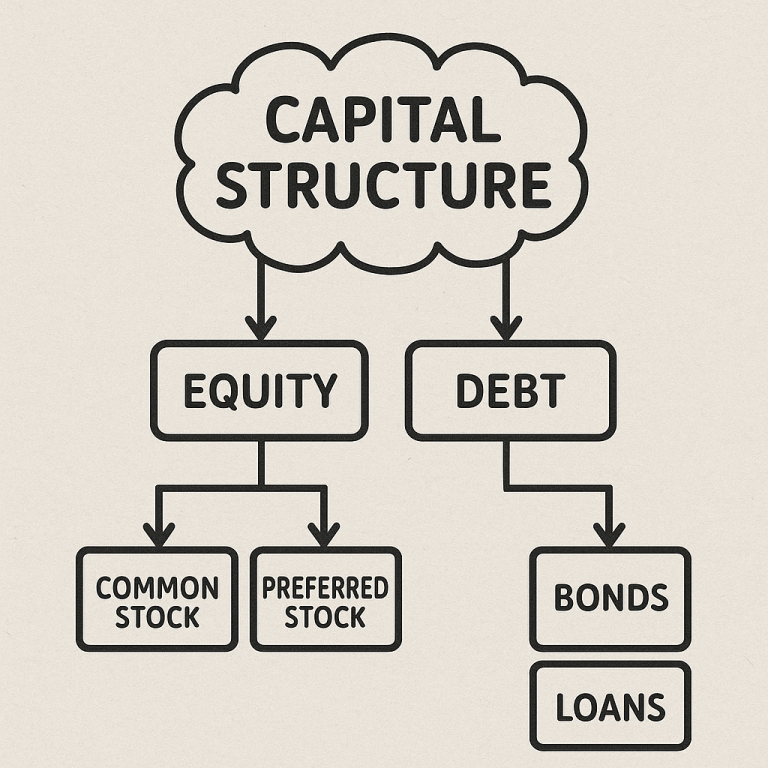
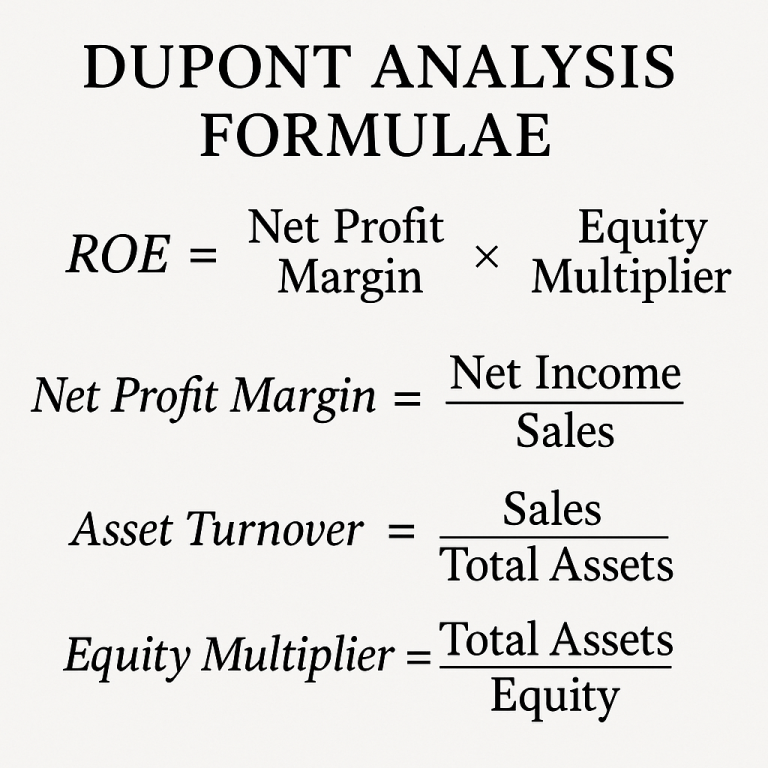
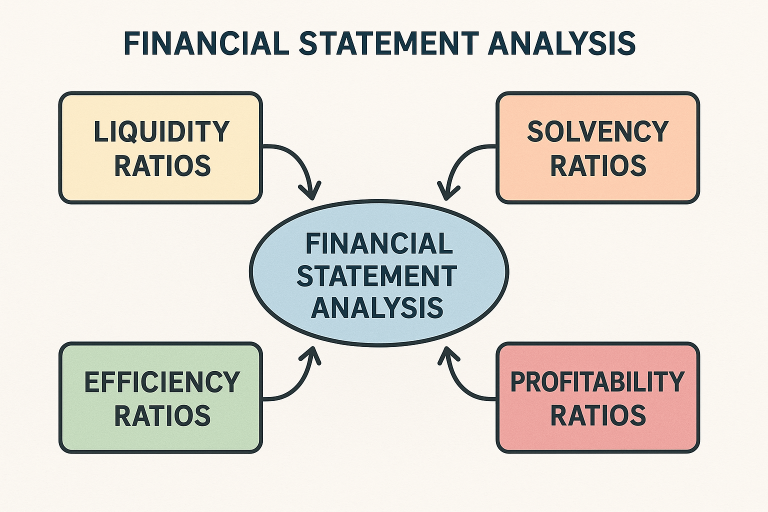
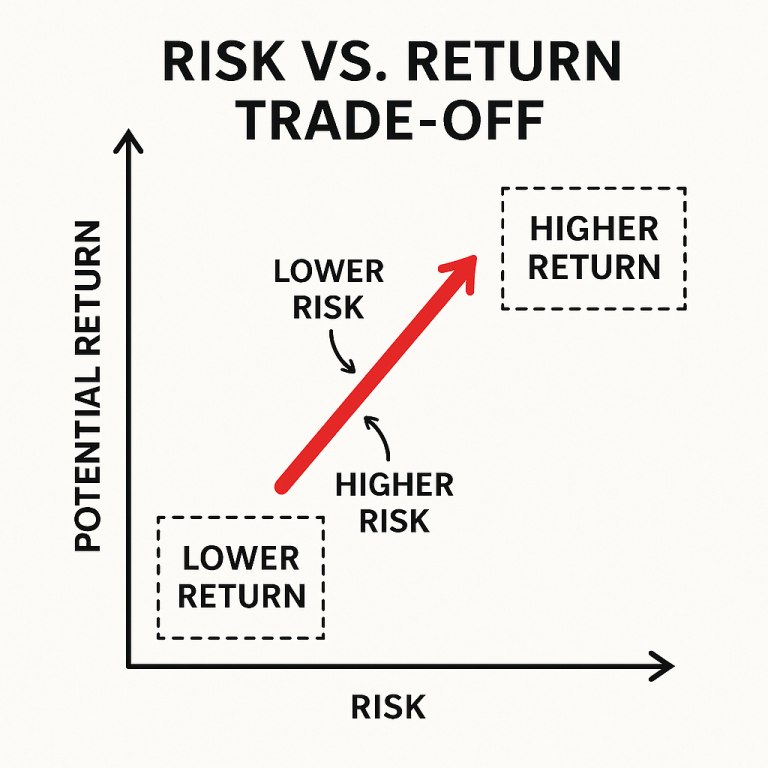
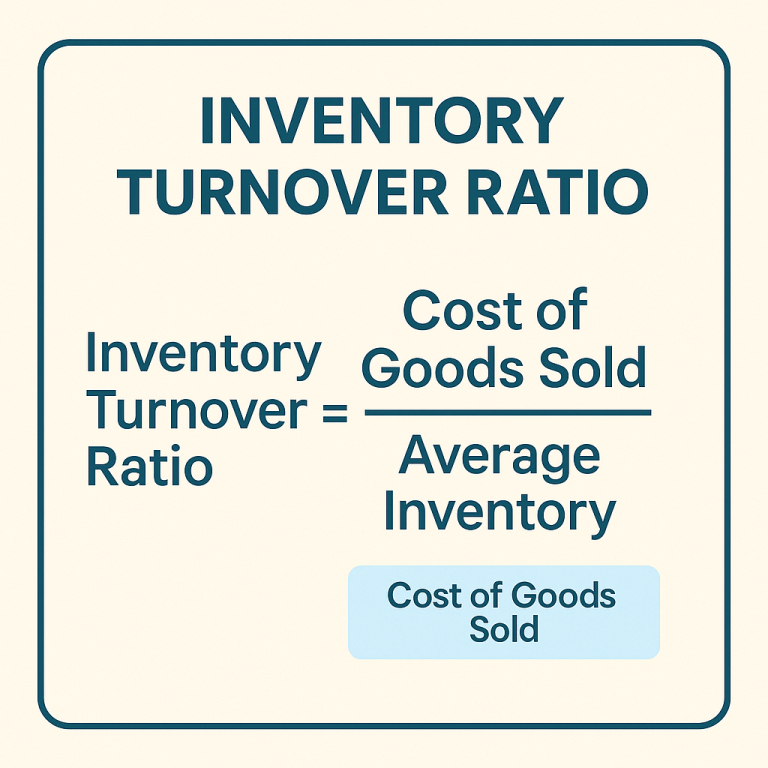
Finance Topics Diagrams
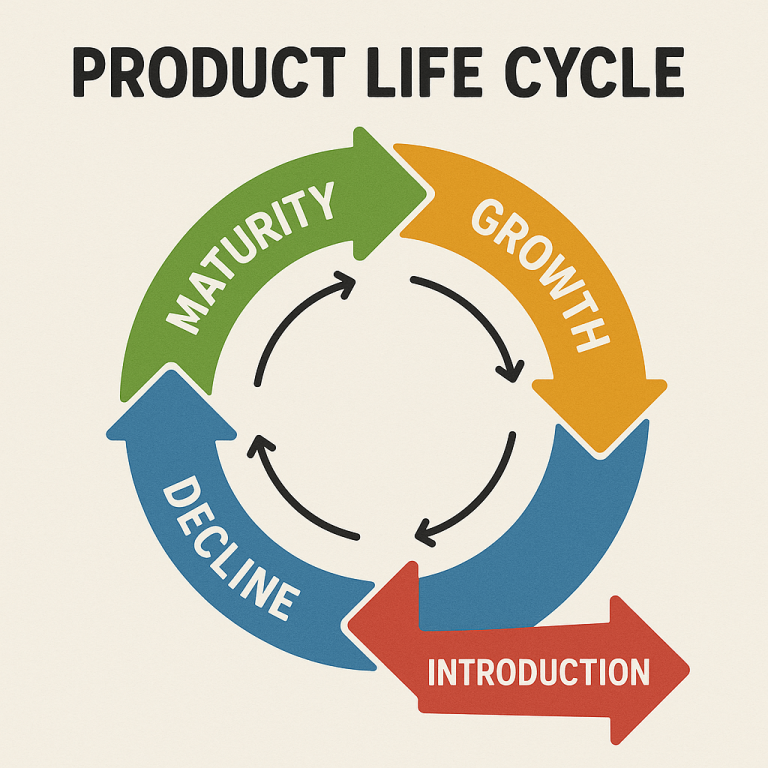
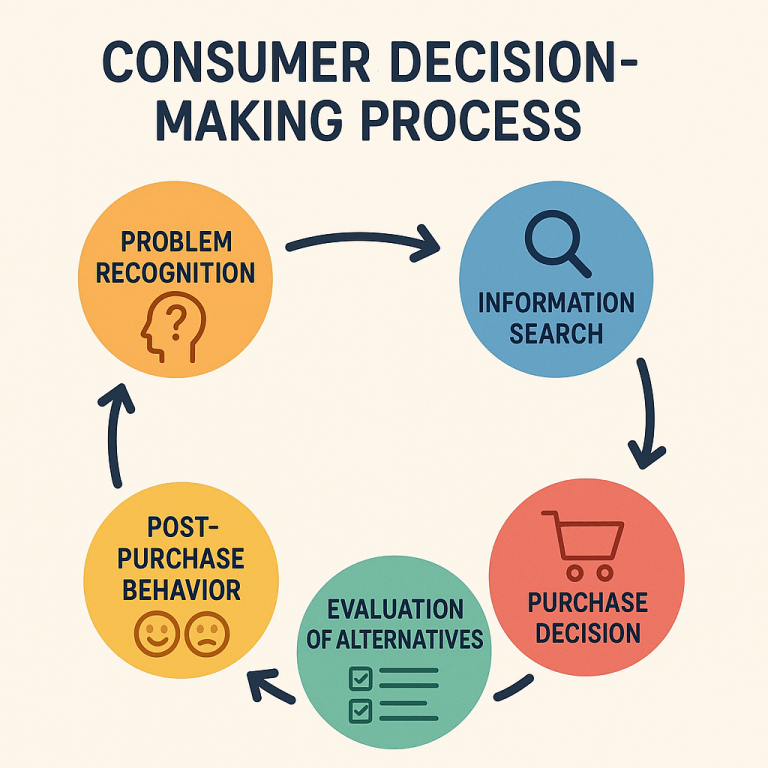
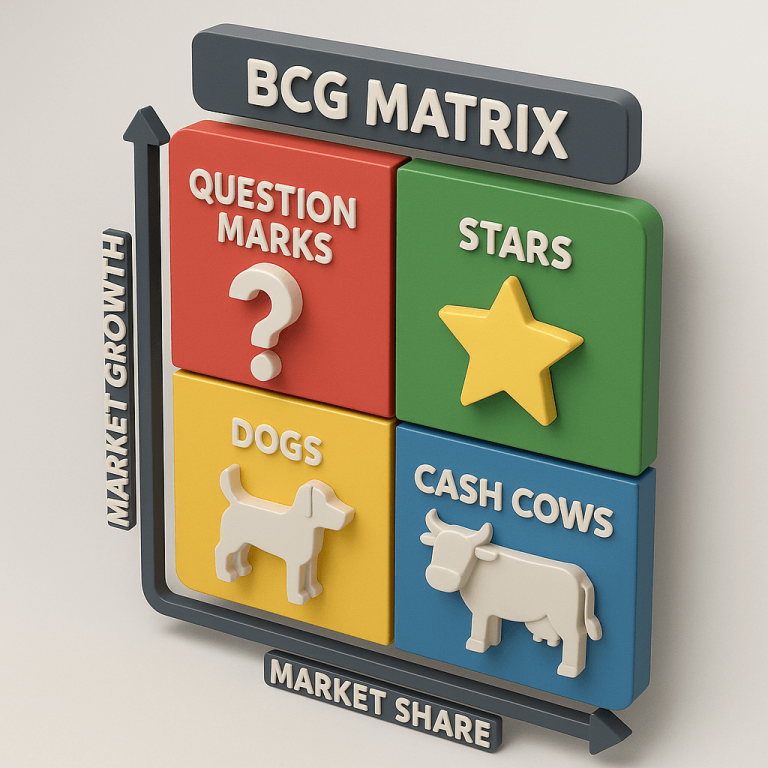
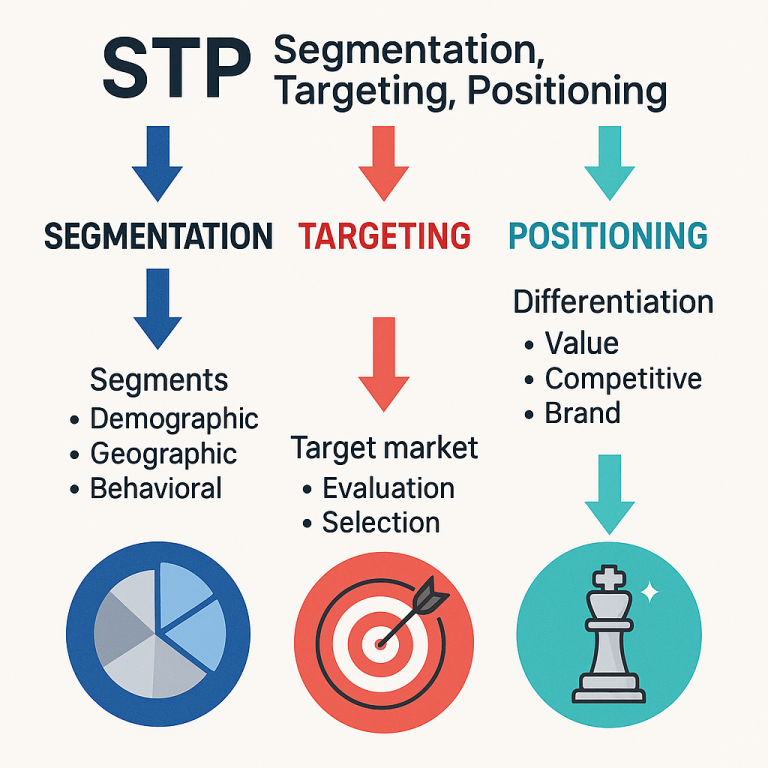
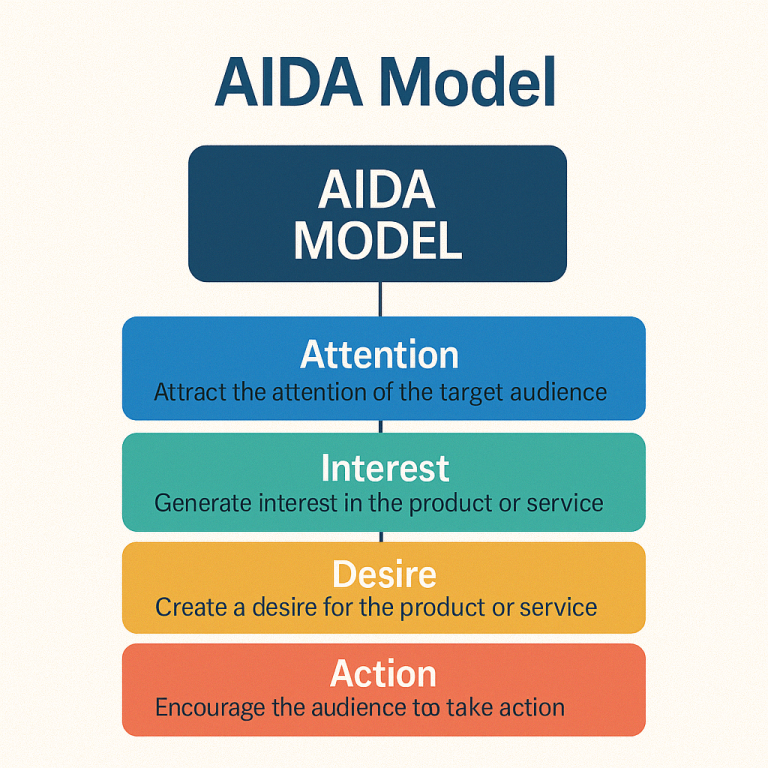
Marketing Topics Diagrams
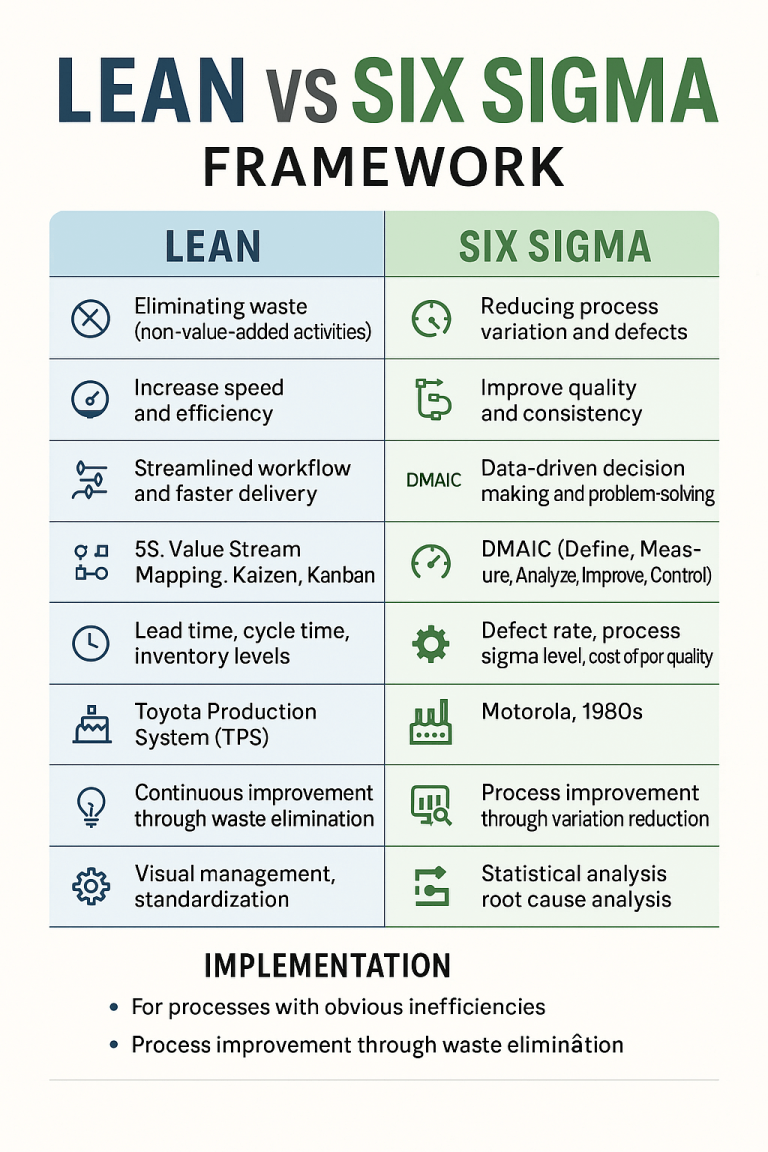
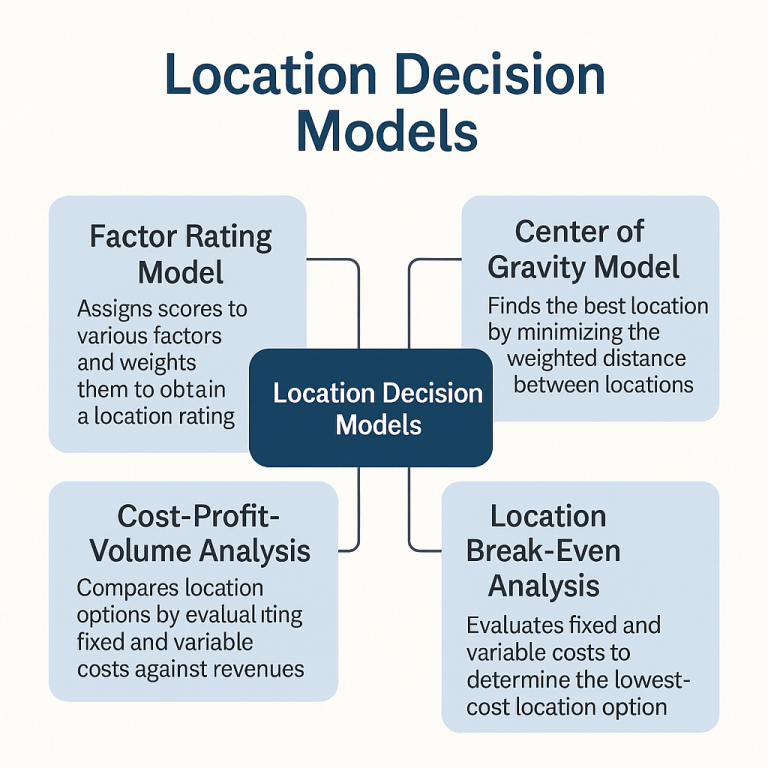
Operation Topics Diagrams
Not found the Diagram or Flow Chart you are looking for? Don's Worry!!
How to Use Them in Real Life
- Study guides: Build flowcharts for tough processes or cycles.
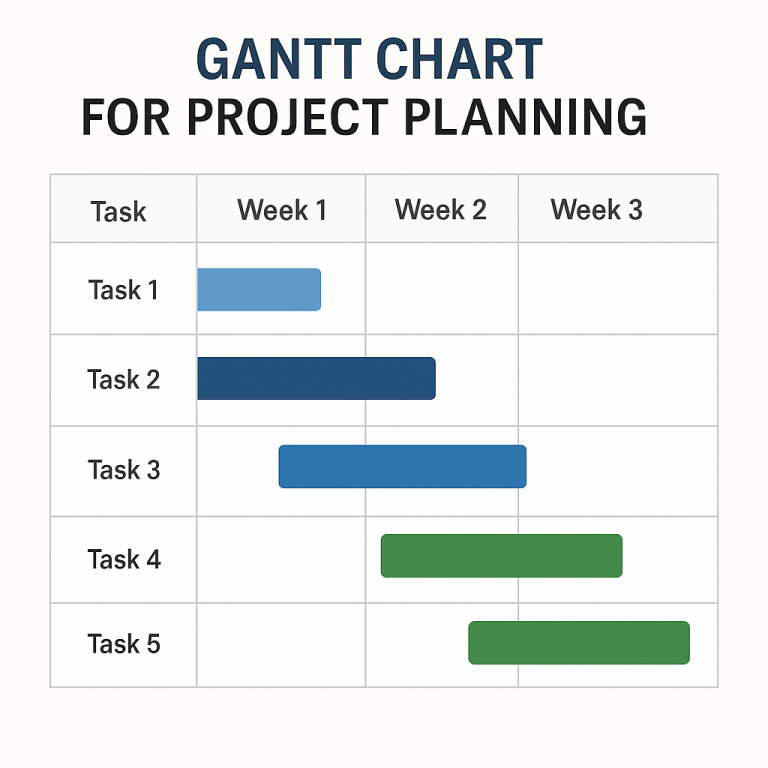
- Project planning: Map out steps from research to final draft.
- Brainstorming: Use diagrams to organize essay ideas.
- Fixing mistakes: Follow each step in your chart to find where you slipped up.
The Bottom Line
Diagrams and flowcharts aren’t just pretty pictures. They help students see connections, remember more, and learn by doing and not just by reading. If you want to study smarter (not just harder), start drawing it out.
How useful was this post?
Click on a star to rate it!
- The Role of Personality Development in MBA Career Success - October 5, 2025
- Best Online MBA Programs in USA - September 27, 2025
- How Important is AI for MBA Students? - September 18, 2025

